Defining Cloud Server Monitoring
Cloud server monitoring is the continuous process of tracking and analyzing the performance, availability, and security of servers hosted in a cloud environment. It’s crucial for maintaining optimal functionality, identifying potential issues proactively, and ensuring a positive user experience. Effective monitoring allows businesses to optimize resource allocation, reduce downtime, and ultimately improve their bottom line.
Cloud server monitoring involves collecting data from various sources within the cloud infrastructure and analyzing this data to identify trends, anomalies, and potential problems. This allows administrators to respond quickly and effectively to issues before they impact users or applications. The core components work together to provide a comprehensive view of server health and performance.
Core Components of Cloud Server Monitoring
The core components of cloud server monitoring encompass several key areas. These include metrics collection, data aggregation and analysis, alerting and notification systems, and reporting and visualization tools. Metrics collection involves gathering data points such as CPU utilization, memory usage, disk I/O, network traffic, and application performance. Data aggregation and analysis consolidate and process this raw data to identify trends and anomalies. Alerting and notification systems immediately inform administrators of critical events, while reporting and visualization tools provide clear and concise summaries of server performance. These elements ensure that potential problems are detected and addressed promptly.
Types of Cloud Server Monitoring Tools
Several types of cloud server monitoring tools are available, each with its strengths and weaknesses. These tools can be broadly categorized as agent-based, agentless, and hybrid approaches. Agent-based monitoring involves installing software agents on the servers themselves to collect data. Agentless monitoring leverages cloud provider APIs to gather data without needing agents. Hybrid approaches combine both methods to leverage the advantages of each. The choice of tool depends on factors such as the scale of the infrastructure, the complexity of the applications, and the specific monitoring requirements. Examples include tools like Datadog, Prometheus, Nagios, and cloud-native monitoring services offered by providers such as AWS CloudWatch, Azure Monitor, and Google Cloud Monitoring.
Key Performance Indicators (KPIs) Used in Cloud Server Monitoring
Key performance indicators (KPIs) are crucial metrics that provide insights into the health and performance of cloud servers. These KPIs help identify areas for improvement and ensure optimal resource utilization. Some of the most commonly used KPIs include CPU utilization, memory usage, disk I/O, network latency, application response time, and error rates. Monitoring these KPIs allows administrators to identify bottlenecks, predict potential failures, and proactively optimize server performance. For example, consistently high CPU utilization might indicate a need for more powerful servers or application optimization, while high network latency could point to network connectivity issues. Tracking these metrics allows for data-driven decisions to enhance overall system performance and reliability.
Monitoring Metrics and Thresholds
Effective cloud server monitoring relies heavily on the careful selection and monitoring of key metrics, coupled with the strategic setting of thresholds that trigger alerts when critical limits are breached. This ensures proactive identification of potential problems before they impact service availability and performance. Understanding the nuances of metric selection and threshold definition is paramount for successful cloud infrastructure management.
Setting appropriate thresholds requires a balanced approach, considering both the sensitivity of the system and the potential for false positives. Too many alerts, even for minor deviations, can lead to alert fatigue and a diminished response to genuine issues. Conversely, thresholds set too high might allow problems to escalate before detection.
Best Practices for Setting Monitoring Thresholds
Establishing effective monitoring thresholds necessitates a deep understanding of your application’s behavior under normal operating conditions. This involves analyzing historical performance data to identify typical ranges for key metrics. For example, CPU utilization might typically hover around 40%, with occasional spikes to 70%. Setting a threshold at 90% would be reasonable, indicating a potential overload. However, a threshold at 55% might generate excessive alerts due to normal fluctuations. Furthermore, thresholds should be adjusted based on anticipated load changes, such as during peak usage periods or planned maintenance. A dynamic threshold system, adapting to current conditions, is often preferable to static values.
Designing an Alerting System Based on Predefined Thresholds
A robust alerting system is crucial for timely intervention. This system should be configurable to send notifications via multiple channels – email, SMS, or through dedicated monitoring dashboards – depending on the severity of the breach. For instance, a minor deviation from the norm might trigger an email alert to the operations team, while a critical threshold breach (e.g., complete service outage) might escalate to an immediate SMS alert to on-call engineers. The alerting system should also include mechanisms for acknowledging and resolving alerts, preventing repeated notifications for ongoing issues. Effective use of deduplication and prioritization features is crucial for managing alert volume and ensuring timely responses.
Real-Time Monitoring Versus Historical Data Analysis
Real-time monitoring provides immediate visibility into the current state of your cloud servers. This is essential for detecting and responding to urgent issues, such as sudden spikes in CPU usage or memory leaks. Historical data analysis, on the other hand, offers valuable insights into long-term trends and patterns. Analyzing historical data allows for capacity planning, identifying seasonal fluctuations in demand, and optimizing resource allocation. Both real-time and historical data are crucial for a comprehensive monitoring strategy. For example, real-time monitoring might detect a sudden increase in database query latency, while historical data analysis could reveal a gradual increase in database size over time, suggesting the need for database optimization or scaling. Combining these approaches enables proactive problem solving and long-term infrastructure optimization.
Types of Cloud Environments
Cloud environments vary significantly, impacting how you approach server monitoring. Understanding these differences is crucial for effective performance management and proactive issue resolution. This section will explore the diverse characteristics of popular cloud platforms and their respective monitoring strategies, including the unique challenges presented by serverless architectures and the contrast between virtual machine and container monitoring.
The major cloud providers – Amazon Web Services (AWS), Microsoft Azure, and Google Cloud Platform (GCP) – each offer a broad range of services, but their underlying architectures and monitoring tools differ. Effective monitoring requires tailoring your approach to the specific provider and the chosen services.
Monitoring Strategies Across Cloud Providers
AWS, Azure, and GCP provide robust built-in monitoring tools, but their interfaces and functionalities vary. AWS relies heavily on CloudWatch, a comprehensive monitoring and logging service offering metrics, logs, and traces. Azure uses Azure Monitor, which integrates with other Azure services for comprehensive observability. GCP utilizes Cloud Monitoring, providing similar capabilities with a focus on data analysis and alerting. While all three offer similar core functionalities, their specific metrics, dashboards, and alerting mechanisms differ, requiring administrators to familiarize themselves with each platform’s unique features. For example, the way CPU utilization is reported might differ slightly between providers, impacting how you set thresholds for alerts. Furthermore, integrating third-party monitoring tools might require different configurations and APIs depending on the cloud provider.
Monitoring Serverless Architectures
Serverless architectures present unique monitoring challenges. Traditional server monitoring relies on observing the performance of individual machines. In a serverless environment, functions are ephemeral and scale automatically. This means traditional metrics like CPU utilization and memory usage are less relevant. Instead, monitoring focuses on function execution time, invocation count, errors, and cold starts. Effective monitoring requires tracing requests across multiple functions, identifying bottlenecks, and analyzing logs to pinpoint errors. Tools like AWS X-Ray, Azure Application Insights, and Google Cloud Trace provide distributed tracing capabilities essential for observing the flow of requests in serverless applications. The ephemeral nature of serverless functions necessitates a shift from traditional server-centric monitoring to event-driven and function-centric monitoring.
Monitoring Virtual Machines versus Containers
Virtual machines (VMs) and containers represent different approaches to virtualization. Monitoring VMs focuses on the overall health and performance of the virtual machine itself, including CPU, memory, disk I/O, and network usage. Container monitoring, on the other hand, needs to track resource utilization at both the container and host levels. Containers share resources on the host machine, requiring monitoring tools to aggregate container-level metrics and correlate them with host-level metrics to identify resource contention. Tools specifically designed for container orchestration platforms like Kubernetes (like Prometheus and Grafana) provide detailed visibility into container performance and resource allocation. While both VMs and containers can leverage similar monitoring tools, the granularity and focus of monitoring differ significantly, necessitating different strategies and metrics. For example, while CPU usage is relevant for both, monitoring container resource limits and sharing becomes crucial for containerized environments.
Security Considerations
Effective cloud server monitoring is crucial, but equally important is securing the monitoring infrastructure itself. Compromised monitoring systems can provide attackers with valuable insights into your network, allowing them to identify vulnerabilities and plan more effective attacks. Robust security practices are therefore essential to protect your data and maintain the integrity of your monitoring system.
Protecting your cloud server monitoring tools and data requires a multi-layered approach encompassing both technical and procedural safeguards. This includes implementing strong authentication and authorization mechanisms, encrypting sensitive data both in transit and at rest, and regularly updating and patching your monitoring tools and infrastructure. Furthermore, a well-defined incident response plan is crucial for effectively mitigating any security breaches.
Security Best Practices for Cloud Server Monitoring Tools and Data
Implementing strong security measures is paramount to protecting your cloud server monitoring tools and data. This involves several key practices. First, utilize strong, unique passwords and implement multi-factor authentication (MFA) for all accounts accessing the monitoring system. This significantly reduces the risk of unauthorized access. Second, encrypt all data both in transit (using HTTPS/TLS) and at rest (using encryption at the database and storage levels). This protects sensitive information even if a breach occurs. Third, regularly update and patch your monitoring tools and their underlying infrastructure. This mitigates known vulnerabilities and reduces the attack surface. Finally, employ robust access control lists (ACLs) to limit access to the monitoring system to only authorized personnel and systems, following the principle of least privilege.
Securing Monitoring Infrastructure Checklist
A comprehensive checklist ensures that all critical security measures are implemented and regularly reviewed.
- Enable Multi-Factor Authentication (MFA): Require MFA for all users accessing the monitoring system, significantly reducing the risk of unauthorized access even if credentials are compromised.
- Implement Strong Password Policies: Enforce complex passwords with a minimum length and character requirements, and encourage regular password changes.
- Encrypt Data in Transit and at Rest: Utilize HTTPS/TLS for secure communication and encryption at the database and storage levels to protect sensitive data.
- Regularly Update and Patch Software: Maintain up-to-date software versions for all monitoring tools and infrastructure components to address security vulnerabilities.
- Employ Access Control Lists (ACLs): Restrict access to the monitoring system using granular ACLs, adhering to the principle of least privilege.
- Regular Security Audits and Penetration Testing: Conduct regular security assessments to identify and address potential vulnerabilities proactively.
- Intrusion Detection and Prevention Systems (IDPS): Implement IDPS to monitor network traffic for malicious activity and automatically respond to threats.
- Log Management and Analysis: Centralize and analyze logs from all monitoring components to detect anomalies and security incidents.
- Regular Backups and Disaster Recovery Plan: Implement regular backups of monitoring data and a comprehensive disaster recovery plan to ensure business continuity in case of a security breach or system failure.
Detecting and Responding to Security Breaches
Detecting and responding swiftly to security breaches is crucial to minimize damage. Continuous monitoring of system logs for suspicious activity, such as unauthorized access attempts or unusual data access patterns, is essential. Automated alerts for critical events can help accelerate detection. A well-defined incident response plan should detail the steps to take in case of a breach, including containment, eradication, recovery, and post-incident analysis. This plan should include communication protocols for informing relevant stakeholders and regulatory bodies as needed. Regular security awareness training for personnel involved in monitoring operations is also critical to improve overall security posture.
Cost Optimization
Effective cloud server monitoring is crucial, but it shouldn’t break the bank. Balancing comprehensive oversight with cost-efficiency is key to maximizing your return on investment. This section explores strategies to optimize your cloud monitoring expenditure without sacrificing essential monitoring capabilities.
Optimizing the cost of cloud server monitoring involves a multifaceted approach encompassing efficient data management, strategic tool selection, and leveraging cloud provider features. By carefully selecting the right monitoring tools and implementing smart data management practices, organizations can significantly reduce their monitoring costs without compromising the quality of their insights. This is particularly relevant for small businesses and startups with limited budgets.
Methods for Optimizing Cloud Server Monitoring Costs
Reducing cloud monitoring costs requires a proactive approach to resource management and data handling. This involves selecting cost-effective tools, efficiently managing alerts, and optimizing data retention policies.
- Choose a cost-effective monitoring tool: Many monitoring solutions offer tiered pricing plans, allowing you to select a level that aligns with your needs and budget. Consider open-source options or those with free tiers for smaller deployments. Evaluate features carefully to avoid paying for functionalities you don’t require.
- Optimize data sampling rates: High-frequency monitoring can generate significant data volumes, increasing costs. Reduce the sampling rate for metrics that don’t require real-time granularity. For instance, CPU utilization might be monitored every minute, but disk I/O statistics could be sampled every five minutes without impacting the ability to detect anomalies.
- Implement efficient alert management: Unnecessary alerts can lead to alert fatigue and wasted resources. Refine your alert thresholds to minimize false positives and prioritize critical alerts. Consolidate alerts from multiple sources into a single dashboard for easier management.
- Utilize cloud provider’s built-in monitoring tools: Cloud providers like AWS, Azure, and Google Cloud offer basic monitoring services often included in the cost of your instances. Leverage these features before investing in third-party tools, especially for smaller deployments.
- Regularly review and optimize your monitoring configuration: Over time, your monitoring needs may change. Regularly review your monitoring setup to identify and remove redundant metrics or unnecessary tools. This ensures you only pay for the monitoring services you actually use.
Strategies for Reducing Unnecessary Monitoring Data
The volume of monitoring data directly impacts costs. Reducing unnecessary data significantly contributes to cost optimization.
- Data aggregation and summarization: Instead of storing raw data points, aggregate data into summaries (e.g., average, minimum, maximum values over a specific interval) to reduce storage needs and processing overhead. This reduces the cost of data storage and processing.
- Filtering and data reduction techniques: Implement filters to exclude irrelevant or redundant data points. For example, you might filter out low-impact events or focus monitoring on specific critical components rather than the entire system.
- Data retention policies: Establish a clear data retention policy that defines how long monitoring data is stored. Retain critical historical data for analysis, but delete less important data after a reasonable period. For example, detailed logs might be retained for a week, while summarized metrics are kept for a month.
- Leverage cloud provider’s managed services: Cloud providers offer managed services for logging and monitoring, which often include built-in data retention policies and automated data cleanup. Utilizing these services simplifies data management and helps optimize costs.
Cost-Effective Monitoring Solution for Small-Scale Deployment
For small-scale deployments, a cost-effective approach involves leveraging free or low-cost tools and focusing on essential metrics.
A small business with limited resources could utilize a combination of a free or low-cost open-source monitoring tool (like Prometheus or Grafana) alongside the basic monitoring features provided by their cloud provider. This approach allows them to monitor key metrics such as CPU utilization, memory usage, disk I/O, and network traffic without incurring significant expenses. They can focus their monitoring efforts on the most critical applications and services, implementing alerts only for critical events. By carefully selecting metrics and configuring appropriate alert thresholds, they can effectively manage their systems and avoid unnecessary costs. Regular review and optimization of the monitoring setup will further enhance cost-effectiveness.
Log Management and Analysis
Effective log management is crucial for proactive cloud server monitoring. By systematically collecting, analyzing, and acting upon server logs, you can significantly improve troubleshooting efficiency, enhance performance, and strengthen security posture. A robust log management strategy allows for the identification of issues before they escalate into major problems, resulting in cost savings and improved service availability.
Log analysis plays a vital role in identifying the root cause of performance bottlenecks, security breaches, and application errors. By examining patterns and trends within log data, administrators can pinpoint problematic areas and implement targeted solutions. This proactive approach minimizes downtime and improves overall system reliability. Furthermore, log analysis provides valuable insights for capacity planning and resource optimization, ensuring that your cloud infrastructure remains adequately provisioned to meet current and future demands.
Centralized Log Collection
A centralized log management system aggregates logs from various sources across your cloud environment into a single, easily accessible repository. This approach simplifies the process of analyzing log data, as it eliminates the need to search across multiple disparate systems. Benefits include improved searchability, reduced data redundancy, and enhanced reporting capabilities. Popular methods for achieving this include utilizing cloud-based log management services such as Amazon CloudWatch, Google Cloud Logging, or Azure Monitor, or employing on-premises solutions like the ELK stack (Elasticsearch, Logstash, Kibana). These solutions often offer features like real-time log streaming, advanced search functionality, and customizable dashboards for visualizing key metrics.
Log Analysis for Troubleshooting and Performance Optimization
Analyzing server logs provides critical information for diagnosing and resolving performance issues. For example, consistently high CPU utilization, as evidenced by log entries indicating prolonged periods of resource saturation, can point towards inefficient code, resource leaks, or inadequate infrastructure provisioning. Similarly, frequent database errors logged can signal the need for database optimization or schema adjustments. Analyzing slow response times correlated with specific log entries can help pinpoint the location of bottlenecks within an application. By correlating log data with performance metrics, administrators can identify patterns and root causes that may otherwise be missed. For instance, slow database queries can be identified by examining both database logs and application logs that show increased latency during specific operations.
Log Aggregation Tools
Log aggregation tools streamline the process of collecting, storing, and analyzing log data from multiple sources. These tools offer centralized management, allowing administrators to view logs from various servers and applications in a single interface. This centralized view significantly improves troubleshooting efficiency and provides a comprehensive overview of system health. Many log aggregation tools offer advanced features such as real-time monitoring, alerting, and reporting capabilities. For example, the ELK stack provides a powerful and flexible solution for log aggregation and analysis, offering features such as log filtering, searching, and visualization. Cloud providers also offer managed log aggregation services, which simplify the deployment and management of log aggregation infrastructure. These managed services often integrate seamlessly with other cloud services, providing a unified monitoring experience.
Visualization and Reporting
Effective visualization and reporting are crucial for understanding cloud server performance and making informed decisions. Well-designed dashboards and reports transform raw monitoring data into actionable insights, enabling proactive issue resolution and optimized resource allocation. This section will explore examples of effective visualizations and reporting strategies for cloud server monitoring.
Effective dashboards provide a high-level overview of key performance indicators (KPIs), allowing for quick identification of potential problems. Reports, on the other hand, offer a more detailed analysis of specific metrics over a defined period, facilitating trend analysis and capacity planning.
Effective Dashboard Examples
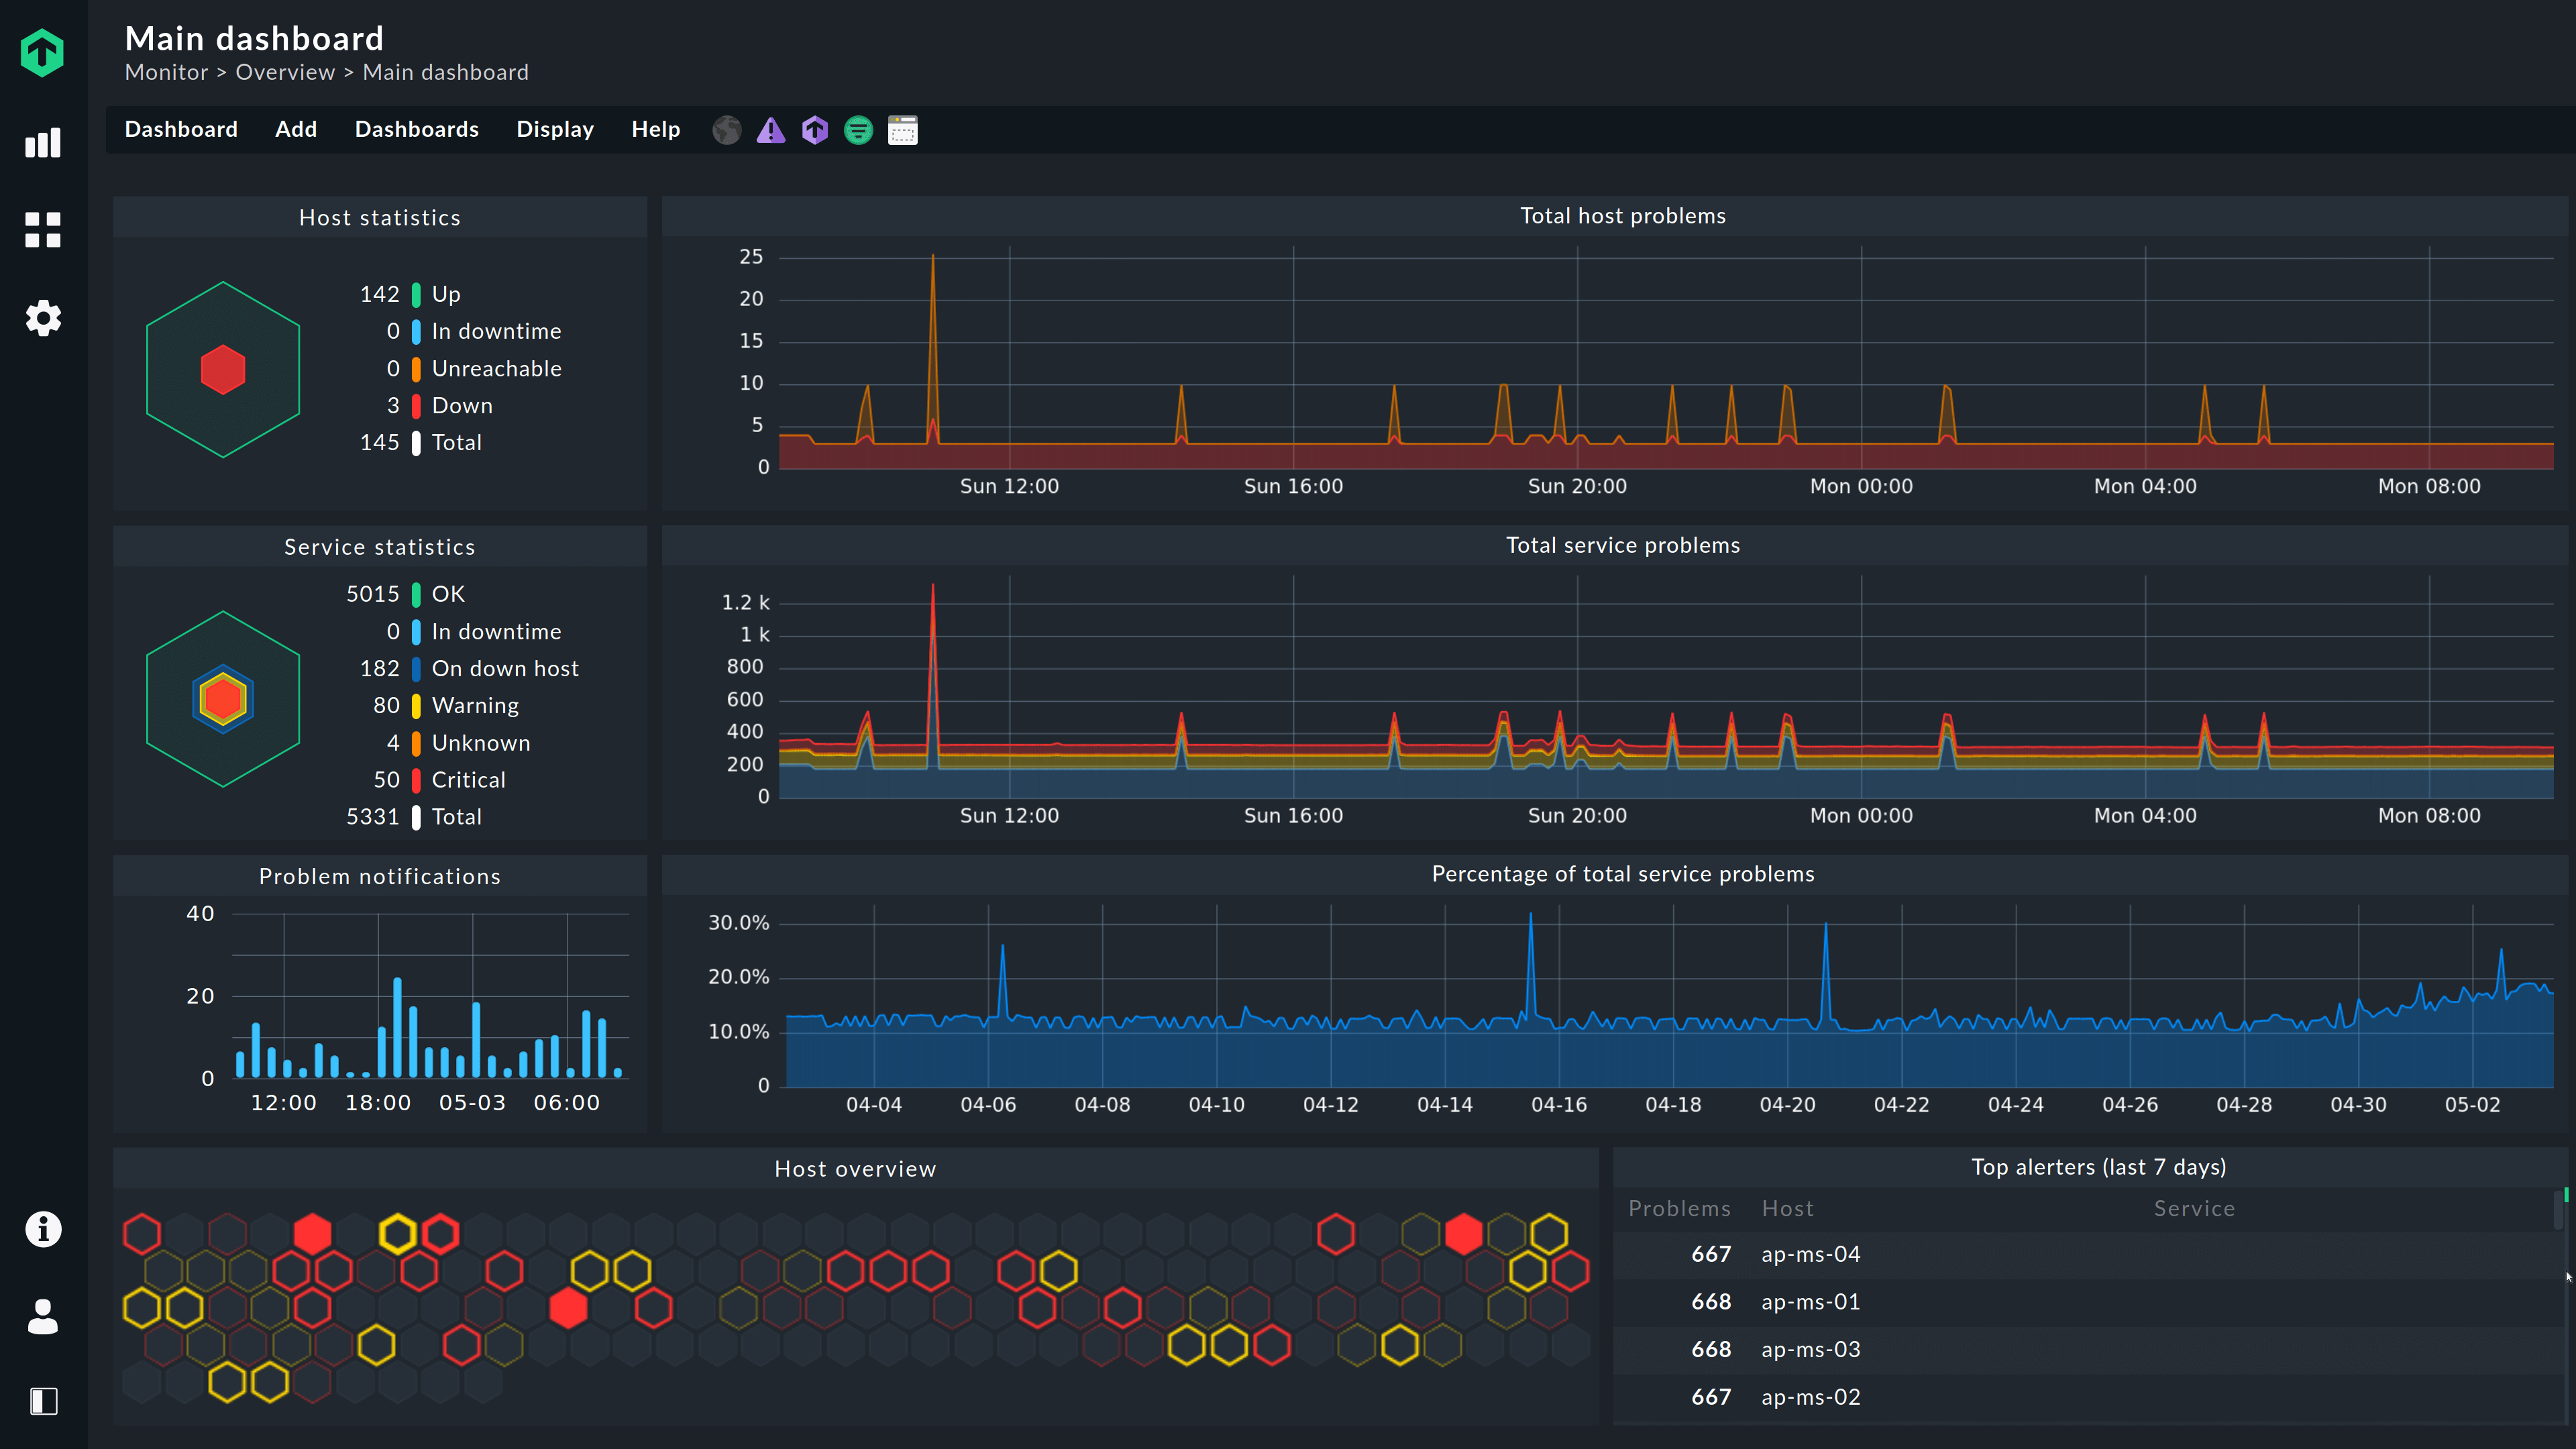
A well-designed dashboard should present the most critical information at a glance. Consider a dashboard displaying CPU utilization, memory usage, disk I/O, and network traffic for multiple servers simultaneously. Each metric could be represented using a line graph showing trends over time, with color-coding to differentiate servers. Critical thresholds could be highlighted using visual cues like red zones on the graphs, indicating potential issues requiring immediate attention. Another useful element would be a summary table showing the current status (e.g., “Normal,” “Warning,” “Critical”) for each server and metric. A geographical map could be incorporated to visualize the location and performance of servers in a distributed environment. Finally, the dashboard should be customizable, allowing users to filter data and focus on specific servers or metrics as needed.
Example Performance Report
The following table presents a sample report summarizing key performance metrics for a web server over a one-week period.
| Metric | Monday | Tuesday | Wednesday | Thursday | Friday | Saturday | Sunday |
|---|---|---|---|---|---|---|---|
| CPU Utilization (%) | 25 | 30 | 28 | 35 | 40 | 20 | 15 |
| Memory Usage (GB) | 8 | 9 | 8.5 | 10 | 11 | 7 | 6 |
| Disk I/O (MB/s) | 50 | 60 | 55 | 70 | 80 | 40 | 30 |
| Network Traffic (GB) | 10 | 12 | 11 | 15 | 18 | 8 | 5 |
This report provides a clear overview of server performance throughout the week, allowing for easy identification of trends and potential bottlenecks. For instance, the increase in CPU utilization and memory usage towards the end of the week might indicate a need for scaling resources.
Best Practices for Presenting Monitoring Data
Effective communication of monitoring data is crucial for ensuring timely issue resolution and informed decision-making. Different stakeholders require different levels of detail and presentation formats. For technical teams, detailed graphs and raw data might be necessary. For management, a high-level summary with key performance indicators and actionable insights is sufficient. Reports should be easily understandable, visually appealing, and tailored to the specific audience. Consider using clear and concise language, avoiding technical jargon where possible. Regularly scheduled reports, combined with ad-hoc reports for specific investigations, ensure stakeholders are kept informed. Interactive dashboards that allow users to drill down into specific metrics provide further flexibility and insights.
Alerting and Notifications

Effective alerting and notification systems are crucial for proactive cloud server monitoring. They ensure timely responses to critical events, minimizing downtime and potential data loss. A well-designed system balances the need for immediate notification of serious issues with the prevention of alert fatigue, which can lead to ignored alerts even when they are important.
Alerting and notification methods should be tailored to the severity of the issue and the urgency required for resolution. A tiered approach, escalating alerts based on their impact, is highly effective.
Alert Delivery Methods
Various methods exist for delivering alerts, each with its strengths and weaknesses. The choice depends on factors such as urgency, accessibility of recipients, and the potential disruption caused by the alert.
- Email: Email is a widely used method, suitable for less urgent alerts or for providing detailed information. However, it can be easily overlooked, especially if many alerts are sent simultaneously.
- SMS (Text Message): SMS offers a more immediate notification, ensuring the recipient receives the alert regardless of their location or access to email. It is ideal for critical alerts requiring immediate action.
- PagerDuty (and similar services): PagerDuty and similar on-call scheduling and alert management platforms provide sophisticated escalation paths, integrating with multiple communication channels. They offer features like automated escalation to on-call teams based on severity and team availability. This minimizes response times for critical incidents and ensures appropriate personnel are notified.
- Push Notifications (Mobile Apps): Many monitoring tools offer push notifications directly to mobile devices. This provides a quick and easily accessible way to receive alerts, particularly useful for personnel who need immediate access to information while on the go.
Escalation Process for Critical Alerts
A well-defined escalation process is vital for ensuring timely responses to critical alerts. This process should Artikel the steps to be taken, the individuals responsible at each step, and the timeframes within which actions should be completed.
For example, a three-tiered escalation process might involve:
- Tier 1: Initial alert to the monitoring team. The team attempts to resolve the issue. If unsuccessful within a defined timeframe (e.g., 15 minutes), escalation occurs.
- Tier 2: Alert escalates to a senior engineer or team lead. More in-depth troubleshooting and potential escalation to other teams (e.g., database administrators) may occur.
- Tier 3: Alert escalates to management, potentially involving external support or service providers. This level typically involves significant system downtime or critical business impact.
Reducing Alert Fatigue
Alert fatigue, the phenomenon of ignoring alerts due to excessive volume, significantly reduces the effectiveness of monitoring. Strategies to mitigate alert fatigue include:
- Effective Alert Filtering: Configure alerts to trigger only on significant events. Avoid noisy alerts caused by minor fluctuations or expected events.
- Alert Grouping and Consolidation: Group similar alerts into single notifications to avoid overwhelming the recipient with repetitive information. For example, instead of multiple alerts for individual server disk space warnings, a single alert indicating multiple servers approaching critical disk space thresholds can be more effective.
- Contextual Alerting: Provide relevant context within the alert, such as the affected server, the nature of the problem, and potential impact. This helps prioritize alerts and facilitates faster resolution.
- Automated Remediation: Where possible, automate the resolution of minor issues, reducing the number of alerts requiring human intervention. For example, automatically restarting a service that has crashed.
- Regular Review and Adjustment: Regularly review alert thresholds and configurations to ensure they remain relevant and effective. Adjust settings based on observed trends and feedback from the team.
Capacity Planning and Scaling
Effective cloud server monitoring is crucial for proactive capacity planning and efficient scaling. By analyzing historical performance data and predicting future resource demands, organizations can avoid performance bottlenecks, minimize costs, and ensure optimal application availability. This involves understanding resource utilization trends and implementing strategies to automatically adjust resources based on real-time needs.
Monitoring data provides the foundation for informed capacity planning decisions. By tracking key metrics like CPU utilization, memory consumption, disk I/O, and network bandwidth, administrators can identify trends and potential bottlenecks. For example, consistently high CPU utilization during peak hours might indicate a need for more powerful instances or horizontal scaling. Similarly, increasing disk I/O could suggest the need for larger storage volumes or improved storage performance. Analyzing these trends allows for proactive resource allocation, preventing performance degradation before it impacts users.
Utilizing Monitoring Data for Capacity Planning
Understanding historical trends in resource usage is paramount. Analyzing data from past periods, such as daily, weekly, or monthly averages, reveals patterns of resource consumption. This analysis can be used to forecast future needs. For instance, if a web application experiences a significant spike in traffic every Friday afternoon, capacity planning should account for this predictable increase. By projecting these trends forward, administrators can ensure sufficient resources are available to handle anticipated demand. This proactive approach minimizes the risk of outages and performance degradation during peak periods.
Strategies for Scaling Cloud Server Resources
Several strategies exist for scaling cloud server resources based on monitoring insights. Vertical scaling involves upgrading to instances with more powerful processors, more memory, or faster storage. This approach is simpler to implement but has limitations. Horizontal scaling, on the other hand, involves adding more instances to distribute the workload. This approach offers greater flexibility and scalability, allowing for a more granular response to fluctuating demand. Auto-scaling features offered by cloud providers automate this process, dynamically adjusting the number of instances based on predefined metrics and thresholds. For example, if CPU utilization consistently exceeds 80% for a sustained period, the auto-scaling mechanism automatically adds more instances to handle the increased load.
Predicting Future Resource Needs
Predicting future resource needs involves analyzing historical data and applying forecasting techniques. Simple methods, such as extrapolating past trends, can be effective for predictable patterns. More sophisticated techniques, like time series analysis or machine learning algorithms, can account for more complex patterns and seasonality. For example, a company launching a new marketing campaign might use historical data from previous campaigns to predict the increase in website traffic and adjust server capacity accordingly. By using these predictive models, organizations can proactively allocate resources, avoiding the need for reactive scaling that can lead to delays and performance issues. Consider a scenario where a retail company observes a consistent 20% increase in website traffic during the holiday season. By analyzing past holiday season data, they can predict the expected increase in traffic for the upcoming year and proactively scale their cloud infrastructure to handle the anticipated load. This ensures a smooth shopping experience for customers and avoids potential website crashes or slowdowns.
Troubleshooting and Performance Optimization
Effective cloud server monitoring is not merely about collecting data; it’s about leveraging that data to proactively identify and resolve performance bottlenecks, ensuring optimal resource utilization and application responsiveness. Understanding common issues and employing systematic troubleshooting methods is crucial for maintaining a healthy and efficient cloud infrastructure.
Troubleshooting performance issues requires a systematic approach, combining data analysis with practical server administration knowledge. Monitoring tools provide the raw data, but understanding the underlying architecture and application behavior is essential for accurate diagnosis and effective resolution. This section will explore common performance bottlenecks and illustrate how monitoring data can be used to pinpoint and address these issues.
Common Performance Bottlenecks in Cloud Server Environments
High CPU utilization, slow disk I/O, insufficient memory, network latency, and database performance issues are frequent culprits in degraded cloud server performance. These bottlenecks often manifest in different ways depending on the application and its architecture. For example, a web application might experience slow response times due to high CPU usage during peak hours, while a database-driven application could suffer from query latency stemming from inefficient database queries or insufficient database server resources. Identifying the root cause requires careful analysis of multiple performance metrics.
Using Monitoring Data to Troubleshoot Performance Issues
Monitoring data provides the crucial clues needed to diagnose performance issues. For instance, consistently high CPU utilization over a sustained period might indicate a poorly optimized application, a resource-intensive process, or insufficient CPU capacity. Slow disk I/O, indicated by high disk queue lengths and slow read/write times, could point to insufficient storage capacity, inefficient storage configurations (e.g., using spinning disks instead of SSDs), or a poorly designed database schema. Similarly, high network latency can be caused by network congestion, inefficient network configuration, or issues with the network infrastructure itself. By correlating these metrics with application logs and other relevant data, administrators can isolate the source of the problem.
Optimizing Server Configurations Based on Monitoring Results
Once performance bottlenecks are identified, appropriate optimization strategies can be implemented. High CPU utilization might necessitate application code optimization, scaling up to a larger instance size with more CPU cores, or load balancing across multiple servers. Slow disk I/O might require upgrading to faster storage, optimizing database queries, or implementing caching mechanisms. Network latency could be addressed by optimizing network configuration, upgrading network bandwidth, or employing content delivery networks (CDNs). These optimizations should be based on the specific insights gleaned from monitoring data, ensuring targeted and effective improvements. For example, if monitoring reveals that a specific database query is consistently slow, optimizing that query can have a significant impact on overall application performance. If monitoring shows memory leaks in an application, addressing those leaks is crucial to prevent performance degradation.
Disaster Recovery and Business Continuity
Effective cloud server monitoring plays a crucial role in establishing robust disaster recovery (DR) and business continuity (BC) plans. By providing real-time insights into system performance and health, monitoring enables proactive identification of potential issues, facilitates swift responses to incidents, and ultimately minimizes downtime and data loss. This proactive approach ensures business operations continue with minimal disruption, even during unforeseen events.
Monitoring ensures business continuity by providing early warnings of potential failures. This allows for proactive mitigation strategies, preventing minor issues from escalating into major outages. Furthermore, comprehensive monitoring data is essential for post-incident analysis, allowing organizations to identify root causes, refine their DR plans, and improve overall system resilience. This iterative process of improvement ensures continuous enhancement of the BC strategy.
The Role of Monitoring in Disaster Recovery Planning
Disaster recovery planning requires a thorough understanding of potential threats and vulnerabilities. Monitoring provides the necessary data to accurately assess these risks. By continuously tracking key metrics such as CPU utilization, memory usage, network latency, and disk I/O, organizations can identify potential bottlenecks or weaknesses in their infrastructure. This information informs the development of effective recovery strategies, including failover mechanisms and data replication plans. For example, consistently high CPU utilization on a critical server might indicate a need for additional resources or a more robust failover system to prevent service disruption during peak loads or failures. Detailed historical data from monitoring tools allows for scenario planning, simulating potential disasters and evaluating the effectiveness of proposed recovery procedures.
Monitoring for Business Continuity During Outages
During outages, continuous monitoring is critical for maintaining visibility into the health of the affected systems and the success of recovery efforts. Real-time alerts regarding the status of backup systems, failover mechanisms, and recovery procedures are vital for effective incident management. For instance, monitoring tools can track the replication status of critical data to secondary locations, ensuring data integrity during a disaster. This constant monitoring provides the information needed to make informed decisions about resource allocation, prioritize recovery tasks, and communicate effectively with stakeholders. Post-outage analysis of monitoring data helps identify the root cause of the disruption, enabling organizations to prevent similar incidents in the future.
Monitoring Critical Systems During a Disaster Recovery Scenario
A comprehensive plan for monitoring critical systems during a disaster recovery scenario should include the following:
- Prioritization of Systems: Identify and prioritize critical systems based on their impact on business operations. This prioritization guides resource allocation and ensures that the most critical systems are restored first.
- Redundant Monitoring Systems: Implement redundant monitoring systems to ensure continuous monitoring even during outages. This might involve using geographically dispersed monitoring agents or cloud-based monitoring solutions.
- Real-time Alerting: Configure real-time alerts for critical system failures or performance degradations. These alerts should be routed to designated personnel, ensuring swift responses to incidents.
- Automated Failover Mechanisms: Integrate monitoring with automated failover mechanisms to ensure seamless transitions to backup systems in case of failures. This minimizes downtime and ensures business continuity.
- Data Replication and Backup Monitoring: Continuously monitor the status of data replication and backup processes to ensure data integrity and availability during recovery.
A well-defined plan, incorporating these elements, ensures that monitoring remains effective even during the most challenging circumstances. This ensures informed decision-making and efficient resource allocation, ultimately minimizing the impact of a disaster on business operations.
FAQ Summary
What are the common signs of cloud server issues?
Common signs include slow website loading times, application errors, high CPU or memory usage, network latency, and increased error rates in logs.
How often should I monitor my cloud servers?
Continuous monitoring is ideal, but at minimum, you should monitor key metrics every few minutes to detect issues promptly.
What is the difference between agent-based and agentless monitoring?
Agent-based monitoring uses software installed on the server to collect data, while agentless monitoring relies on APIs and other methods to gather information without installing software.
How can I prevent alert fatigue?
Implement robust alerting thresholds, prioritize alerts based on severity, and use tools that consolidate and filter alerts to avoid overwhelming notifications.